
01
See
16+ product families, one pane, a customer portal and an iOS app. Every layer, from switches to SQL, on the same screen.
Nº 03DESistem · Multi-Tenant NOC Platform
Argos brings your network, security, virtualisation, storage, backup and database layers together in a single pane. AI identifies root causes; during critical outages, the on-call engineer receives a phone call; and your SLA is reported using measured data. Deployment: one virtual appliance on site, with no firewall changes.
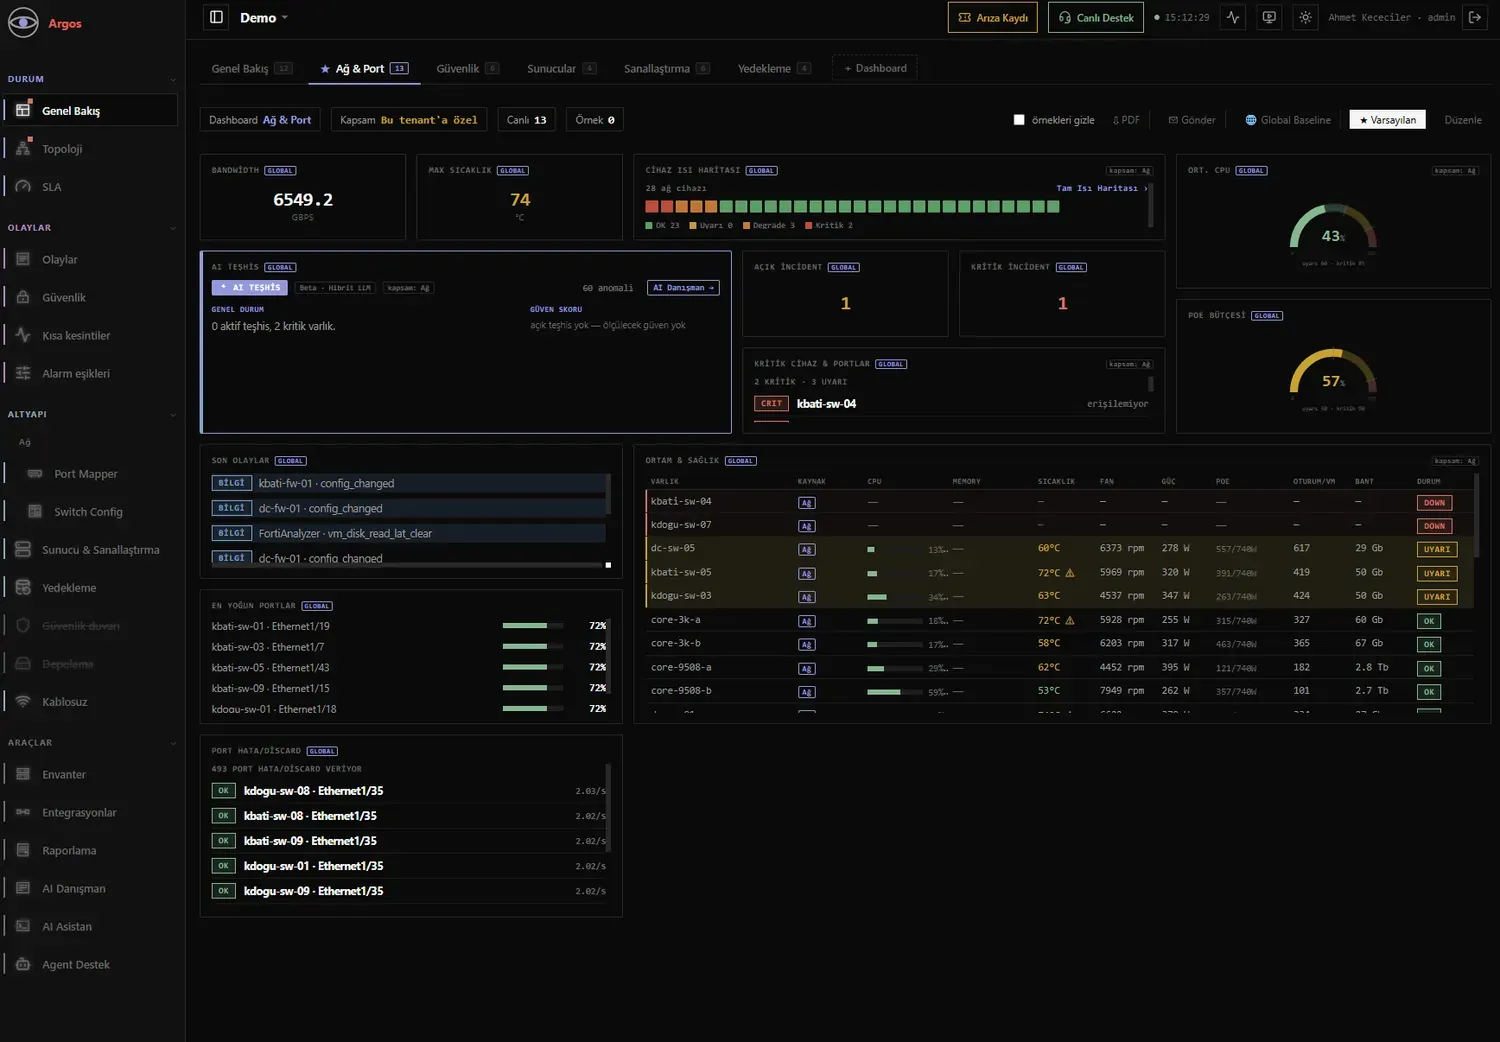
Network, ports, security, servers, virtualisation and backup in one pane. Screenshots are from a demo environment.
Problem
Traditional monitoring tools show you charts; you have to find someone to interpret them. Argos is a managed service: the platform and a 24/7 NOC come together.
| Who | What they face today | Argos's answer |
|---|---|---|
| IT Manager / CIO | “I hear about outages from users.” · “I can’t give management an SLA report.” · “I don’t have a team to monitor 24/7”. | 24/7 NOC service, customer portal, measured SLA reporting, mobile push |
| Systems / Network Administrator | Five separate vendor consoles · alert noise · “who changed this config?” | One pane and 16+ product families · intelligent alerts (flap, redundancy and edge-down deduplication) · config audit |
| Information Security / Compliance | Unauthorised change tracking · audit evidence · risk of external access | Config versioning and attribution · compliance scanning · outbound-only mTLS, no inbound ports |
| Service Provider / Data Centre | Multi-customer monitoring · customer transparency · circuit SLA | Multi-tenant architecture · isolated portal per customer · SLAs by circuit, port and device |
| Decision-maker | “I want to see it first.” | Health Check: pre-sales trial — same product, zero notification risk, evidence pack delivered |
Tabloyu yana kaydırın →
01
16+ product families, one pane, a customer portal and an iOS app. Every layer, from switches to SQL, on the same screen.
02
AI root-cause analysis, anomaly detection, capacity forecasting and config audit. Not just “what failed”, but “why”.
03
To the right person, exactly once: email, push, message or phone. An incident ticket is created automatically when needed.
Key Features
A single OVA is installed on site. The appliance opens an encrypted, mutually authenticated (mTLS) channel to the centre, outbound only. No inbound rule, VPN or exposed SSH is required. Maintenance, updates and terminal access to switches (WebSSH) use the same channel.
The security team’s first question is “who will connect to us from outside?” The answer: nobody.
The alert engine stores its full state in the database. Even after an update or restart, the same event will not wake you a second time. If a notification is interrupted, the event is retained and retried. If an edge connection drops, hundreds of devices behind it do not generate separate alerts: one “site connection lost” notification is sent.
Noise is not signal.
Under the defined policy, Argos uses a voice call to alert the on-call engineer about critical, ongoing outages. Notification channels: email, Mattermost, iOS push, voice call and automatic incident ticket.
Five channels, one event, one notification.
The AI layer engages for every event: root-cause analysis, affected services and recommended actions. Anomaly detection learns each metric’s own baseline; capacity forecasting answers “when will it fill up?”. Threat feeds cross-reference genuine CISA KEV and NIST NVD data with the products the customer actually uses.
No irrelevant CVE noise.
Switch and network-device configurations are collected regularly and versioned, with line-by-line diffs. Changes are attributed to the user who made them; when attribution is uncertain, the system presents candidates rather than guessing. AI-assisted compliance scanning runs on top.
At audit time, the answer to “who changed it?” is ready.
SLA reports are calculated from raw measurement data, not alert logs; raw data is retained for 365 days. Reports are available by circuit, port, device, redundant switch pair and product. “Unable to measure” time is recorded separately; it counts as neither downtime nor uptime.
The report does not hide its own blind spots.
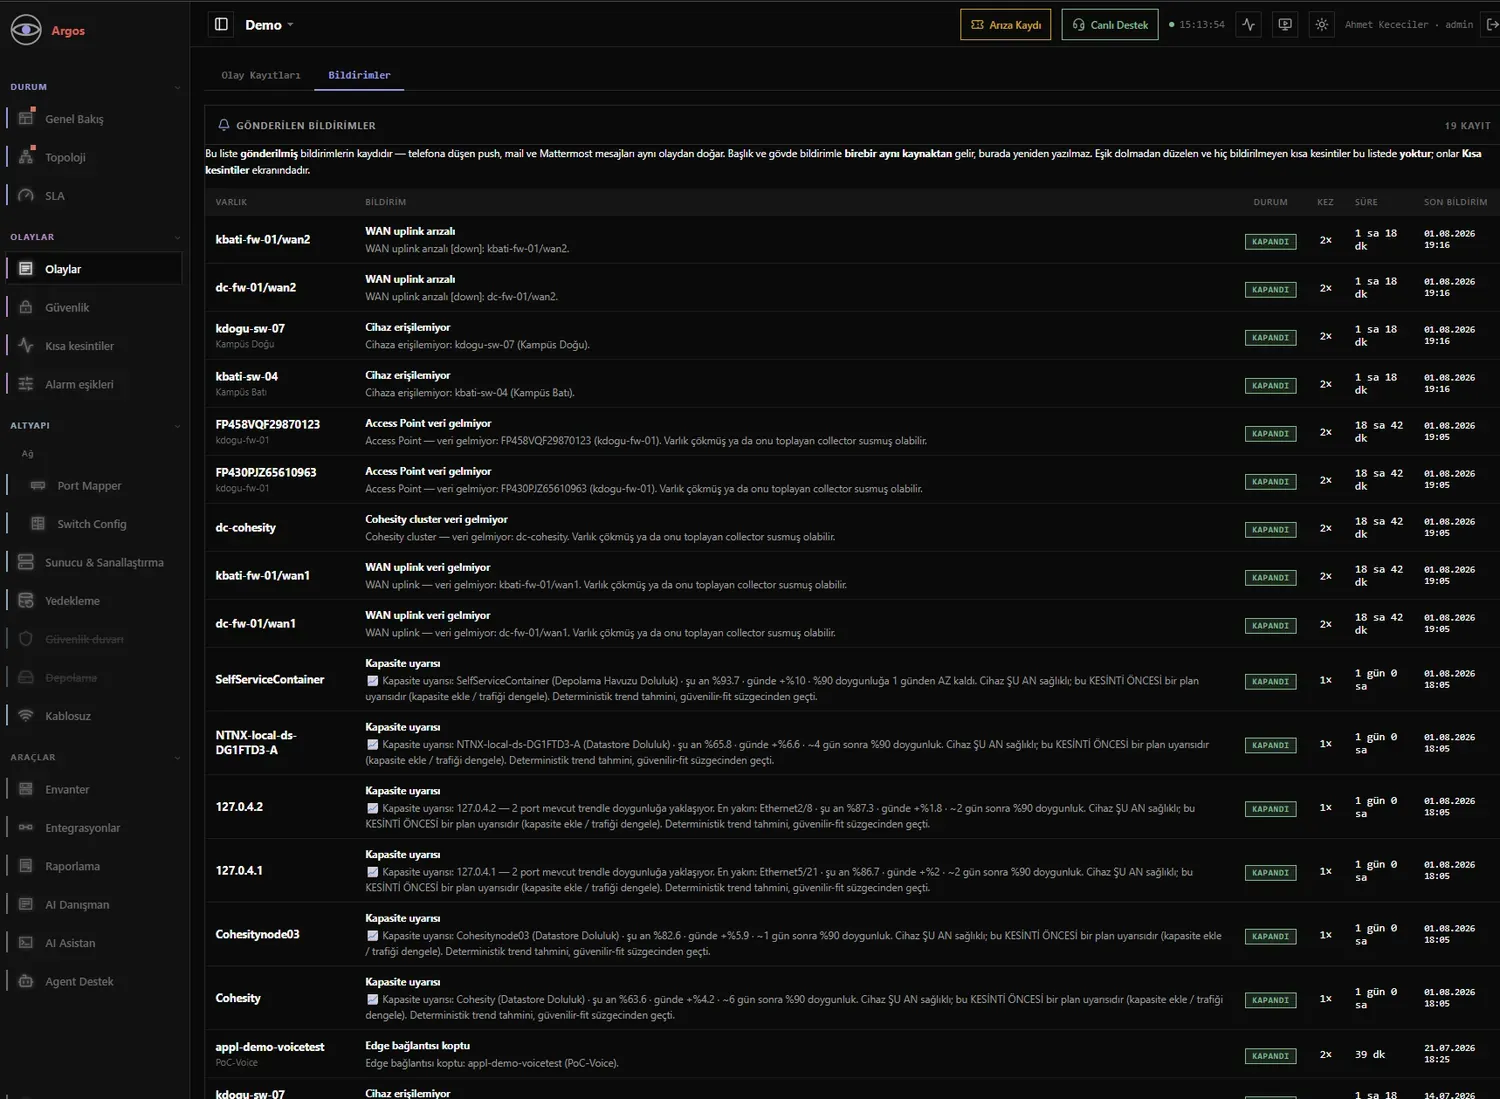
Push notifications, emails and messages on your phone all stem from the same event. Brief outages that clear before the threshold is reached are shown on a separate screen.
How It Works
Site (edge) → encrypted channel (mTLS, outbound only) → centre → AI and alerts → you: dashboard, mobile, phone, PDF.
01
One OVA on site. The onboarding wizard identifies the appliance and obtains its certificate. Takes minutes.
02
Add switches individually, by CSV or subnet scan; connect integrations using API credentials.
03
The edge appliance collects data via SNMP, SSH, APIs and syslog. If the connection drops, it buffers data so nothing is lost.
04
The centre stores data in an isolated schema per customer; the alert engine and AI layer run continuously.
05
The right audience (customer / NOC), through the right channel (email, push, message, phone), exactly once.
06
SLA reports, dashboard PDFs, daily briefings and short-outage summaries.
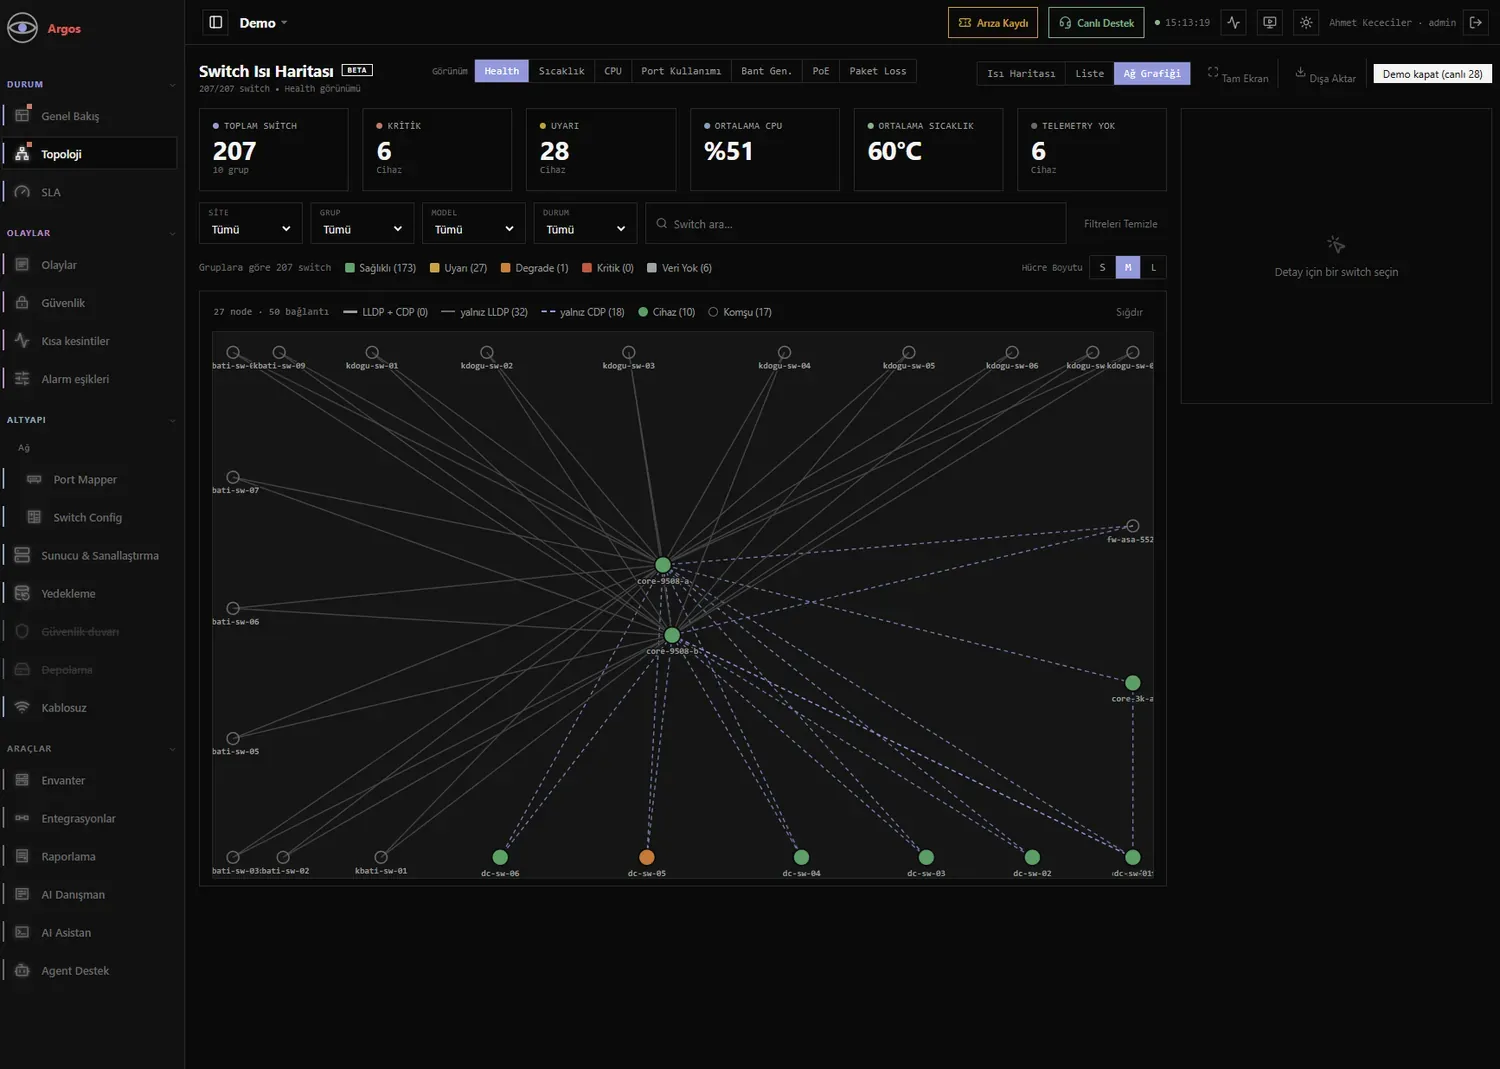
Network graph automatically drawn from LLDP and CDP neighbours; 207 switches, 10 groups.
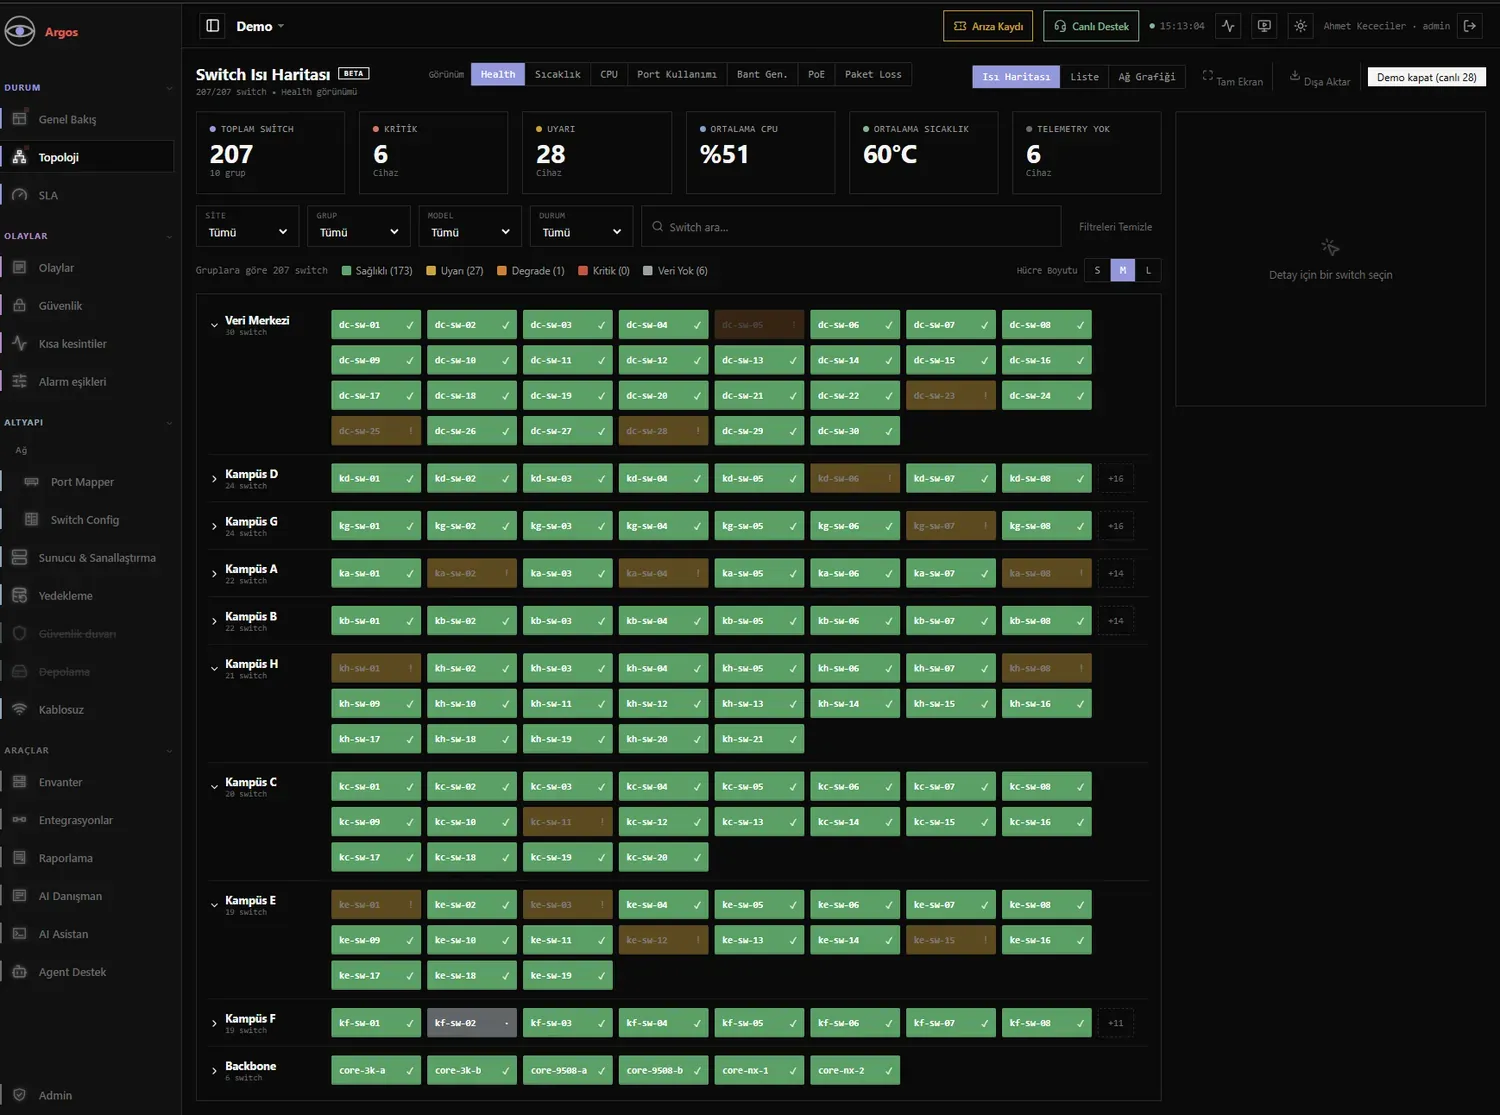
Views of health, temperature, CPU, port utilisation, bandwidth, PoE and packet loss.
Artificial Intelligence
The AI layer does two things: prioritises findings and tells you what to do, and lets you ask questions about your infrastructure in natural language.
Prioritises all findings and presents them in full on one screen. Each item includes a “verify” step, down to the command level.
A morning summary of infrastructure status: critical capacity, security, virtualisation and the previous 6 hours.
Uses 22 separate tools to query live data. Permissions are built into the assistant: customers can only ask about their own data.
Confidence scores are measured, never invented. Where something cannot be measured, it is marked “unspecified”. Fabricated CVE numbers from AI are automatically removed from output. If the root cause is not certain, the system says “the evidence does not establish a definitive root cause” and lists possible causes.
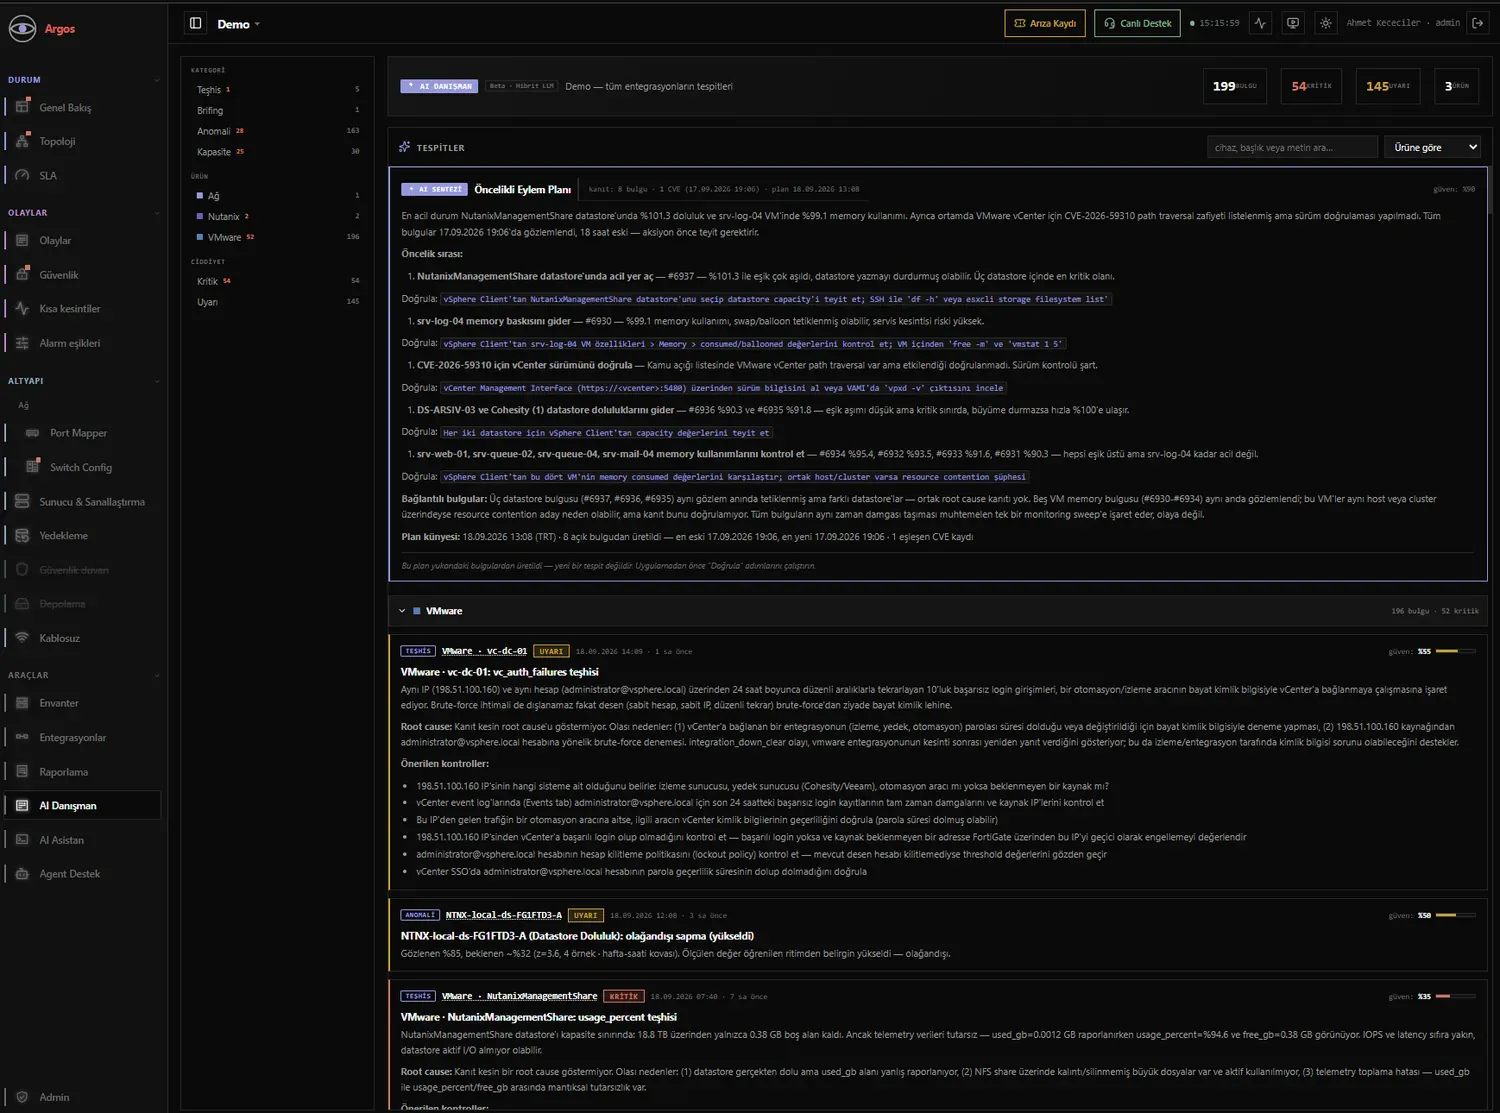
Findings are prioritised, each step includes a verification command, and related findings are linked.
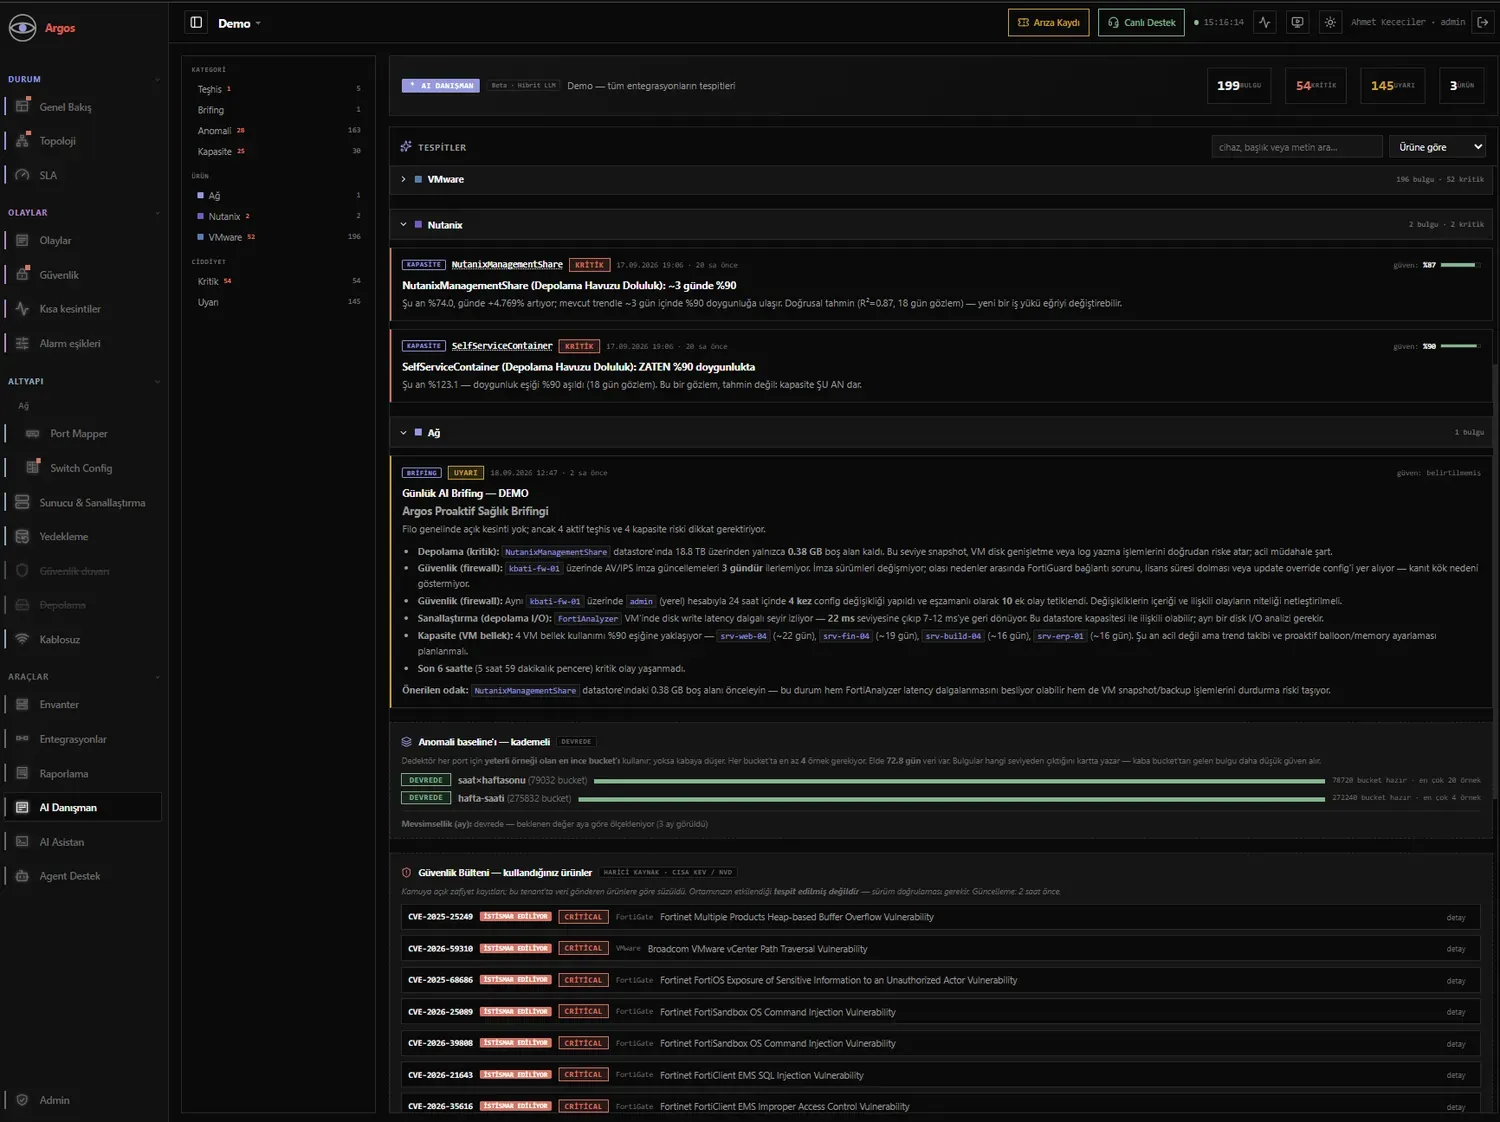
CISA KEV and NVD data filtered to products for which the tenant submits data.
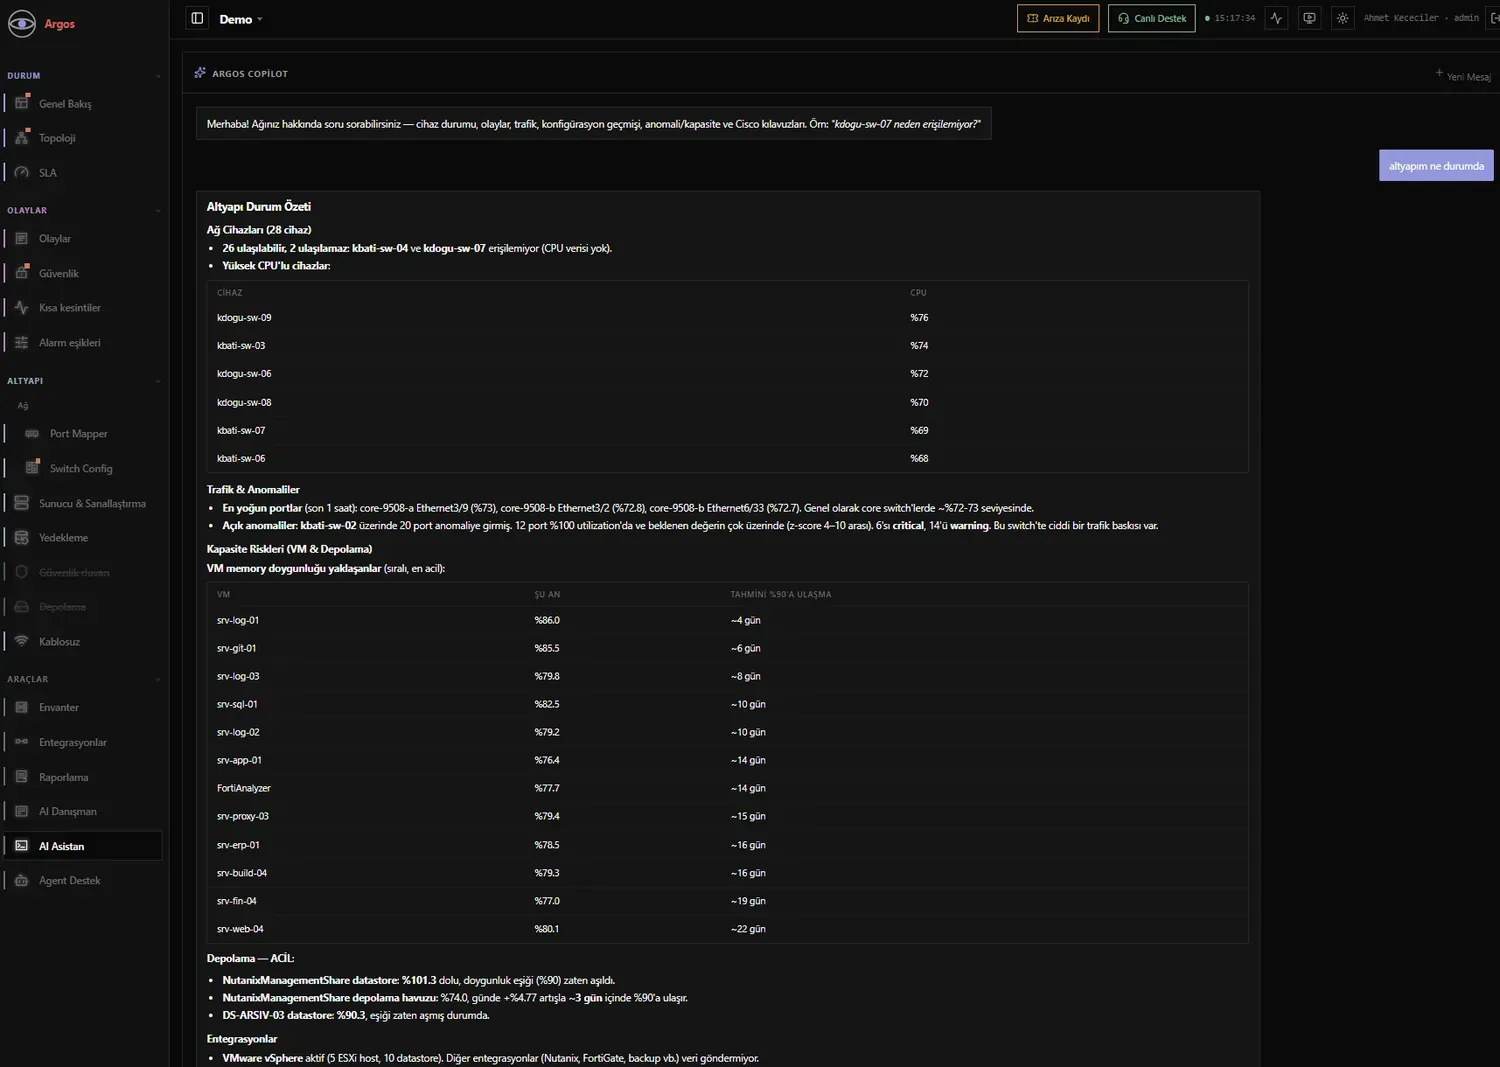
Live data and tables answer “What is the state of my infrastructure?”.
Config Audit
Configurations are collected regularly and versioned. Differences are shown line by line, and changes are attributed to the user who made them. Secrets such as passwords and keys are masked both on screen and in data sent to AI.
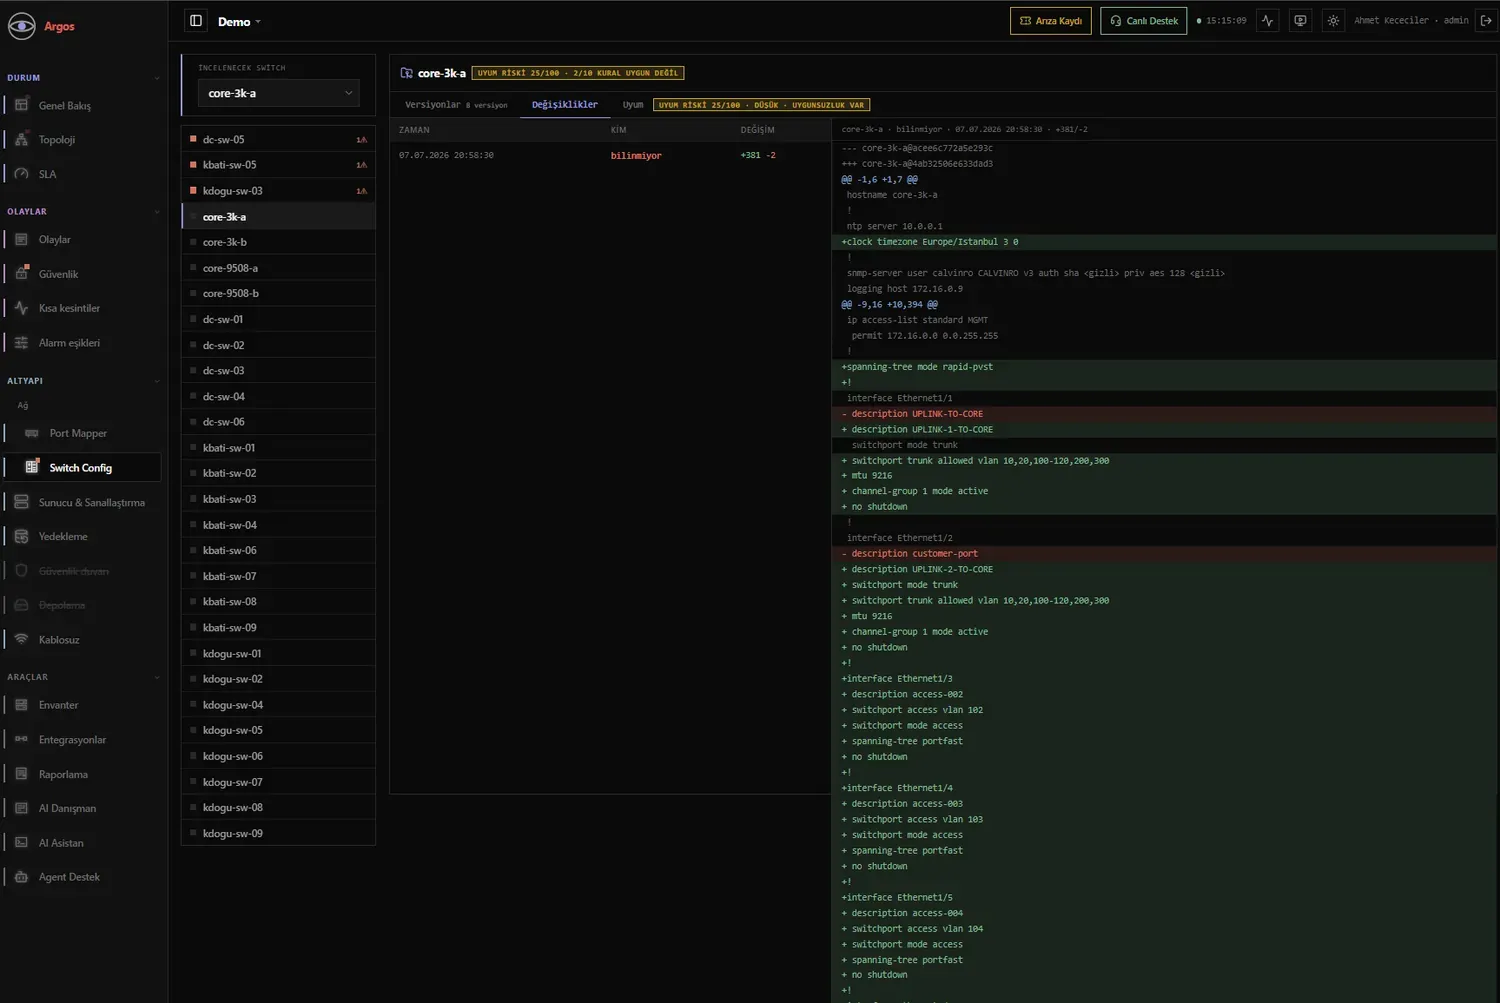
Compliance risk score, version tree and line-by-line diff. Secrets are masked as <hidden>.
Scope
Adding a product is a configuration task, not a coding project — so the list grows quickly. If your product is not listed, ask us.
| Service Area | Monitored Items |
|---|---|
| Network | SNMP-based switches and routers · port status and traffic · bandwidth · topology · Port Mapper · redundant circuit detection (vPC, VLT, LAG) · syslog · config audit |
| Firewall | Fortinet FortiGate (system, VPN tunnels, WAN, session load) · Palo Alto Networks NGFW · WAN flood/DDoS signal (learned threshold) |
| Server & Virtualisation | VMware vSphere / vCenter (host, VM, datastore) · VMware vSAN · Nutanix AHV/Prism · server hardware via Redfish: health, power, temperature, PSU |
| Storage | Dell PowerVault ME · Dell Data Domain · vSAN · datastore capacity |
| Backup | Veeam Backup & Replication · Dell PowerProtect Data Manager · Cohesity · Data Domain — failed-job alerts, run reports |
| Wireless | Cisco Catalyst 9800 / WLC · H3C WLC · Fortinet FortiAP |
| Database | Microsoft SQL Server: availability · AlwaysOn AG health (sync status, queues, quorum) · backup age and RPO/RTO tracking · database corruption alerts |
| Identity & Other | Cisco ISE · UPS (any make that supports standard UPS-MIB) |
Additional capabilities: inventory (serial number, IP, model) · customer-specific threshold management · integration health monitoring (which collector has stopped responding) · security events screen.
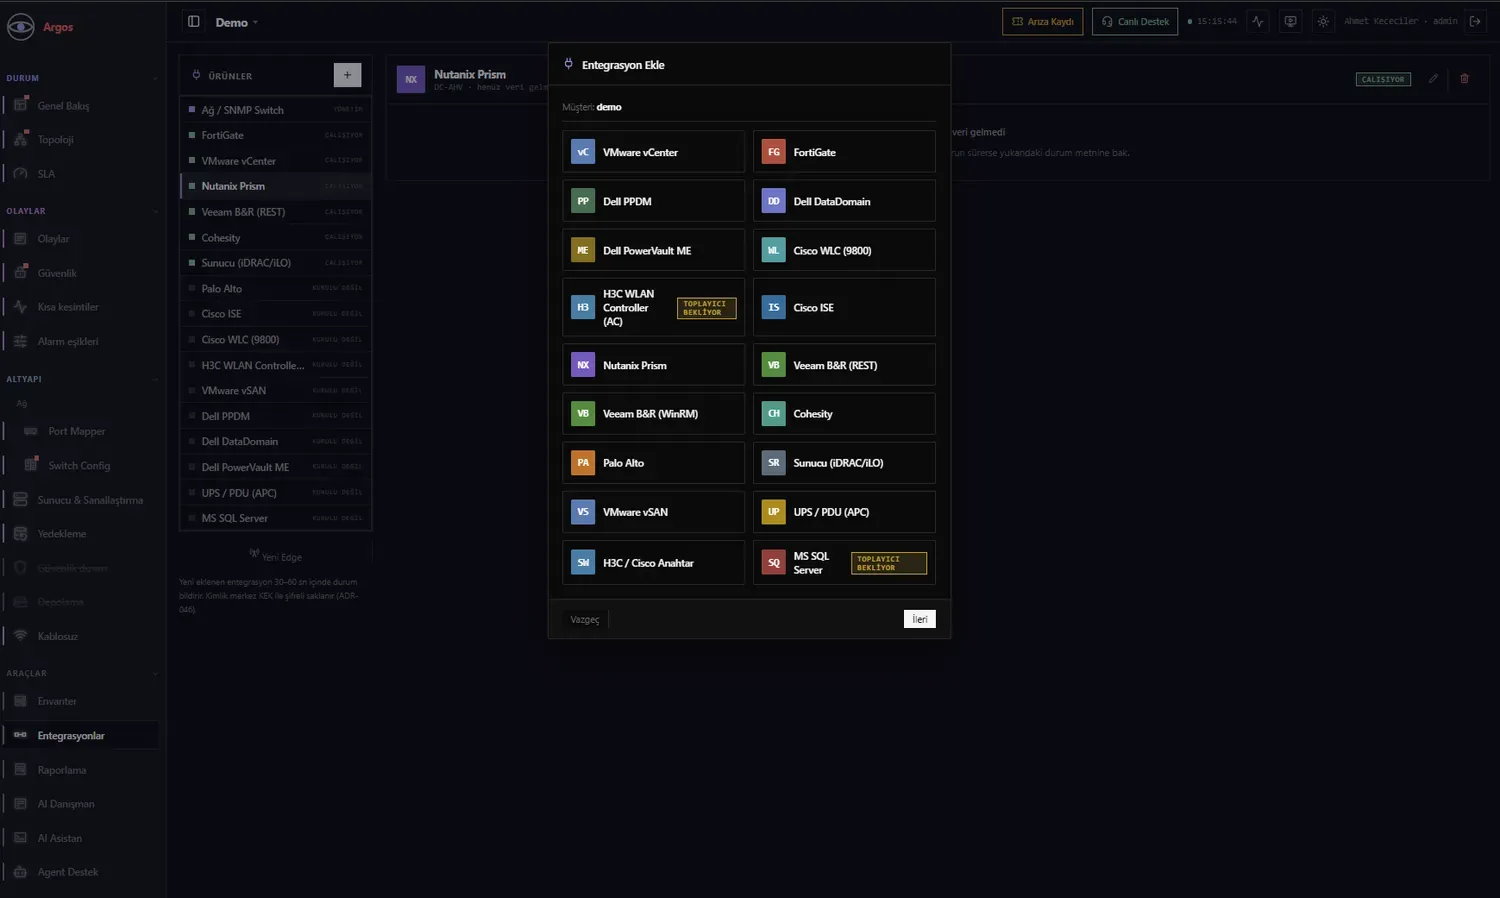
Add product families from the dashboard. Credentials are stored encrypted at the centre.
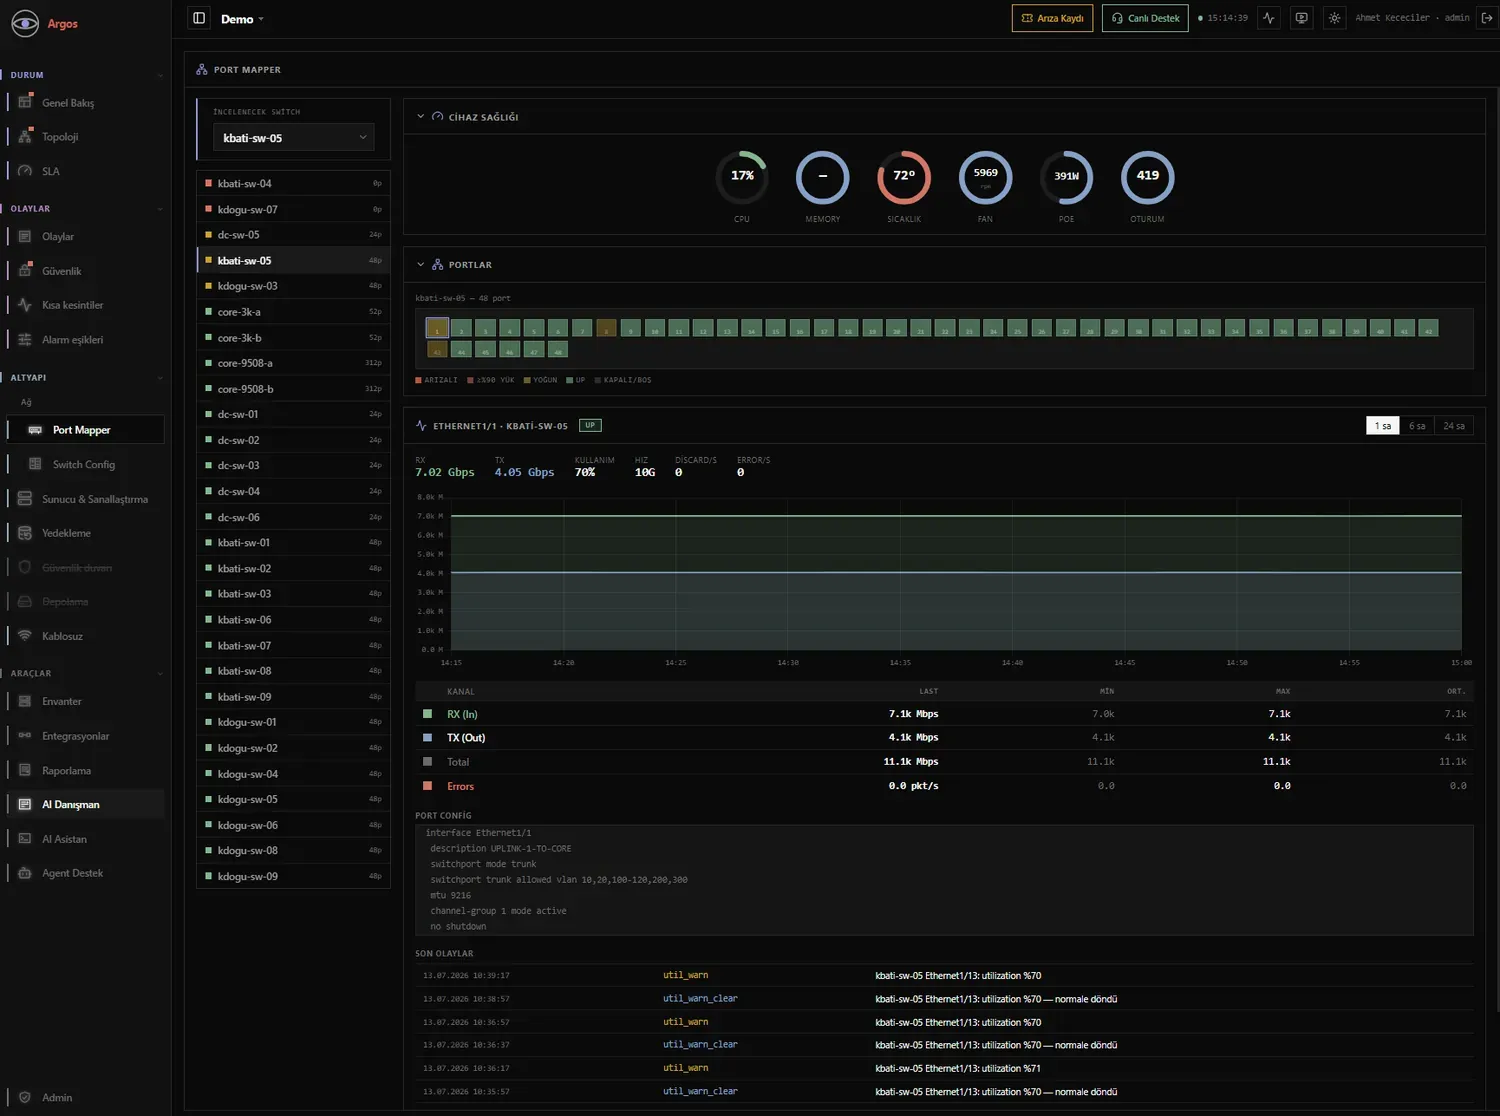
Traffic, errors, discards and active config by port — all on one screen.
Security
The site accepts no inbound connections; there are no inbound ports. Each edge appliance has its own certificate (mTLS); unauthenticated devices cannot send data.
Each customer’s data is held in a separate database schema; cross-customer queries are architecturally impossible. Authorisation controls are tested through automated gates in every release.
Device passwords are stored encrypted. Secrets are masked in config screens and in data sent to AI. Role-based access: admin, engineer, customer.
Sensitive content is processed by a local model; only data deemed appropriate is sent to the cloud.
Edge software updates are distributed as signed packages in rings (lab → canary → customer); a faulty release is halted before it reaches customer sites.
Who logged in and when, which report was sent to whom, and which device was accessed by terminal — all recorded.
1.700+ automated tests, quality gates run on every release, regular chaos exercises — deliberately injecting faults and checking that alerts actually fire — and a defined SLO catalogue. The answer to “who monitors the monitoring system?” is a self-monitoring dead-man’s switch and watchdog.
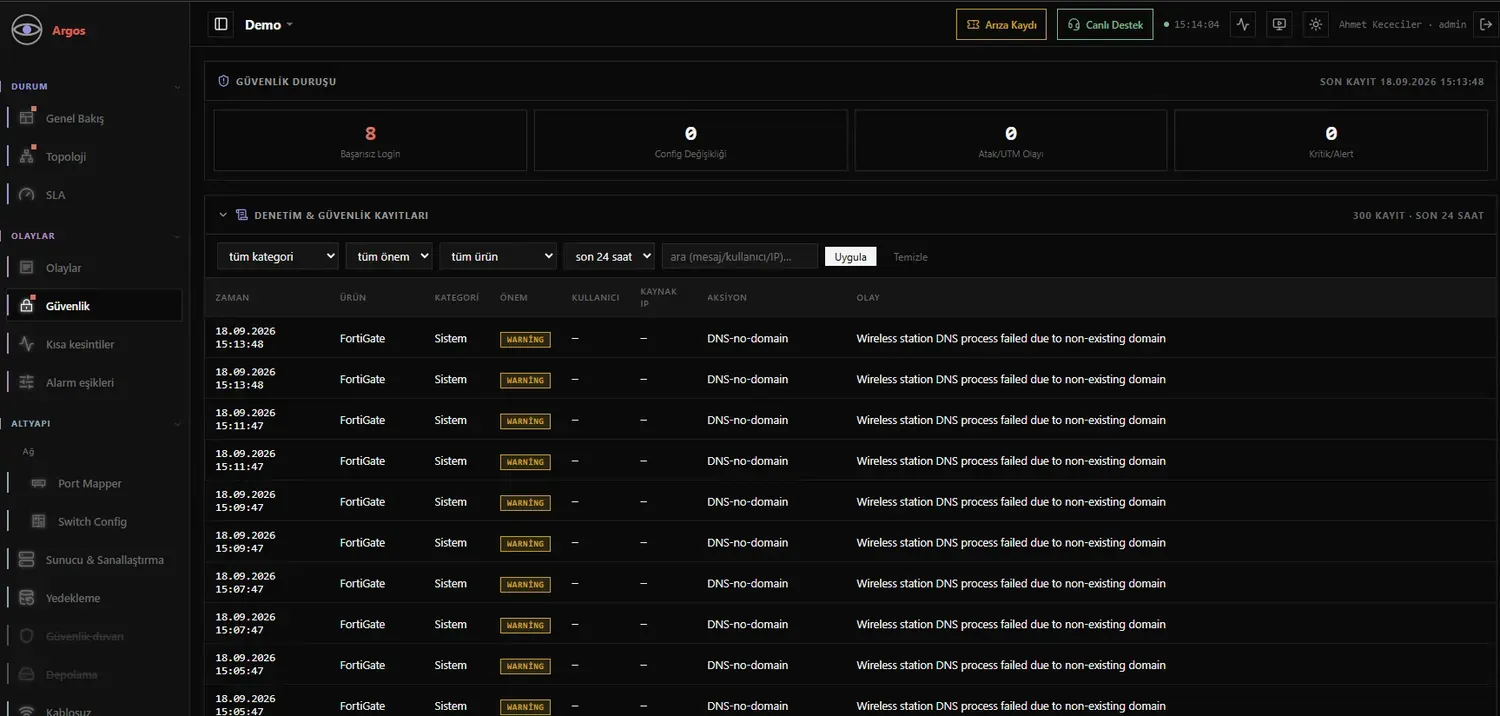
Failed logins, config changes, attacks and UTM events are counted and logged on one screen.
Comparison
| Traditional monitoring tool | Argos | |
|---|---|---|
| Model | You buy a licence, install it and monitor it yourself | Managed service: platform + 24/7 NOC |
| Approach | Reactive — charts after an incident | Proactive — anomalies, capacity forecasts, config intelligence |
| Alerts | Threshold exceeded → email; repeats after restart | State stored in database, exactly once; flap, redundancy and edge-down awareness; phone calls |
| Root cause | Left to the operator’s interpretation | AI root-cause analysis + service impact + vendor knowledge base |
| Config | Usually a separate product | Versioning, diff, attribution and compliance scanning — built in |
| SLA | Estimated from alert logs | From raw data, retained 365 days, with “unable to measure” recorded separately |
| Access | Usually requires inbound access or VPN | Outbound-only, no inbound ports |
| Transparency | Operator console | Customer portal + iOS app |
| Reporting | Separate reporting module | The dashboard itself becomes a PDF |
Tabloyu yana kaydırın →
This is a category-level comparison and does not target any specific product.
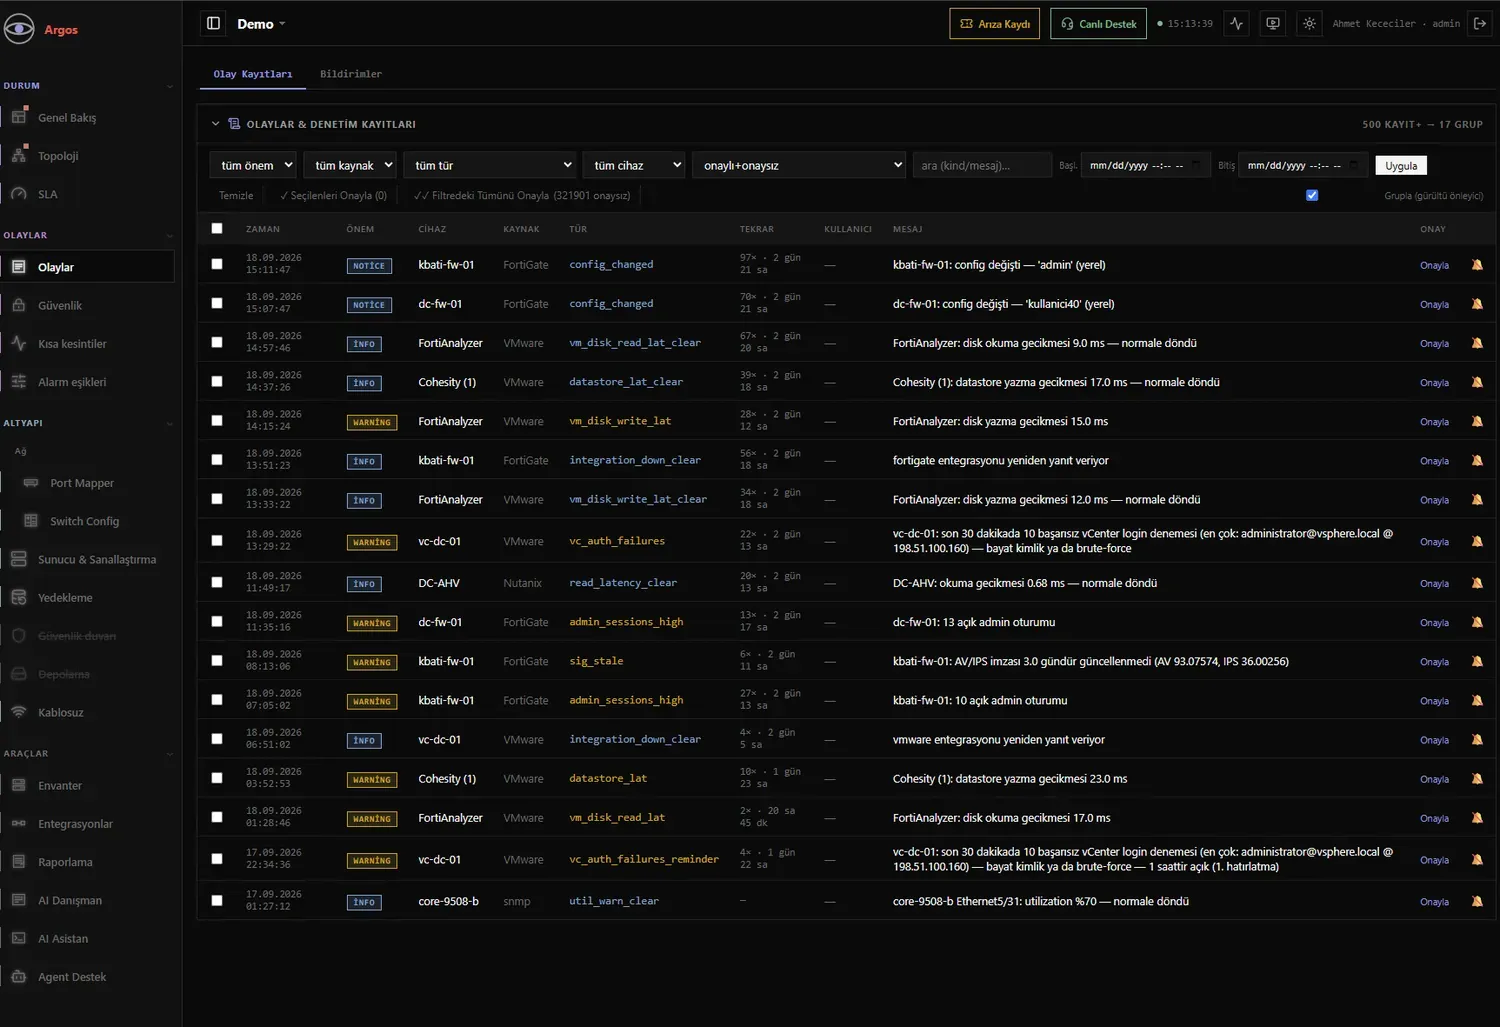
Noise-reduction grouping is enabled: repeated instances of the same event appear on one line, with the count and duration.
Argos by the Numbers
Health Check
Pre-sales trial mode: the same product, the same edge appliance, real data collection. The difference: during the trial, no alerts are sent to anyone through any channel. It runs in shadow mode.
01
Tell us briefly about your needs and environment.
02
One virtual appliance on site. No firewall changes.
03
Real data is collected; no alerts are sent to anyone.
04
Findings are delivered as an evidence pack: a readable report and raw data.
05
If you proceed, the trial account becomes a customer account in place; no reinstallation, and collected history is retained.
Argos can run alongside it. That is exactly what the Health Check is for: compare it in your own infrastructure, with your own data, without taking a risk.
Frequently Asked Questions
One virtual appliance (OVA) is installed on site. The onboarding wizard connects it to the centre in minutes; add devices and integrations from the dashboard.
Nothing inbound. The edge appliance makes a single encrypted (mTLS) outbound connection.
The 16+ product families listed in the Scope section. Any network device that supports SNMP is monitored at a basic level; integrations for unlisted products can be added quickly.
Each customer’s data is stored in a separate, isolated schema; cross-customer queries are architecturally impossible.
Sensitive content is processed by a local model; passwords and keys are masked before data reaches AI.
The edge appliance buffers data locally and sends it when the connection returns. The centre detects the site disconnection and sends one notification, rather than separate alerts for the hundreds of devices behind it.
Both. The NOC team sees everything; you receive only the event types relevant to you. Audience, channel and thresholds are configured for each customer.
No. Argos can run alongside it; that is exactly what the Health Check is for.
An iOS app is available. Critical events arrive as instant push notifications; open events and fleet status are visible on one screen, and sessions can be revoked remotely.
Contact
We start with an Infrastructure Health Check: one virtual appliance on site, real data, zero notifications. At the end, you have an evidence-based snapshot of your environment — then you decide whether to proceed.
argos@desistem.com.tr
argos.desistem.com.tr
Barbaros Mah. Mor Sümbül Sok.
Varyap Meridian Business I Blok No:1 Kat:16
Batı Ataşehir · +90 216 574 27 27
Mustafa Kemal Mah. Dumlupınar Bulvarı No:266
Tepe Prime Avenue · Çankaya
+90 312 220 44 01